ACO Name and Location
Connected Care of Northwest Tennessee, LLC Trade Name/DBA: Connected Care of Northwest Tennessee, LLC
3401 West End Ave., Suite 290,
Nashville, TN, 37122, U.S.A
Primary Contact
Katie Herron
(615) 875-0834
katie.herron@vhan.com
Participants
No participants are involved in a joint venture between ACO professionals and hospitals.
- Best Care Clinic PLC
- Clarksville Health System GP
- Clarksville Internal Medicine, PLC
- Clarksville Physician Services GP
- Covenant Family Practice, PC
- Elite Primary Care LLC
- Premier Medical Group PC
- Stephan A. White, M.D., P.C.
Governing Body
- Giri Korivi - Premier Medical Group PC, ACO Participant Representative, Voting Power: 11.1%
- Joseph Kosinski - Premier Medical Group PC, ACO Participant Representative, Voting Power: 11.1%
- Karen Nanney - Clarksville Physician Services GP, ACO Participant Representative, Voting Power: 11.1%
- Missy Liverett - Premier Medical Group PC, ACO Participant Representative, Voting Power: 11.1%
- Randy Davis - Clarksville Health, ACO Participant, Voting Power: 11.2%
- Robert Wilson - Covenant Family Practice, PC, ACO Participant Representative, Voting Power: 11.1%
- Roger Edwards - N/A, Medicare Beneficiary Representative, Voting Power: 11.1%
- Steve White - Stephen A. White, M.D., P.C., ACO Participant Representative, Voting Power: 11.1%
- Valerie Bryant - Clarksville Health System GP, ACO Participant Representative, Voting Power: 11.1%
Clinical and Administrative Leadership
- Katie Herron - ACO Executive
- Stephen White, M.D. - Medical Director
- Kim Wilson - Compliance Officer
- Pam Bruce - Quality Assurance / Improvement Officer
Types of ACO Participants, or Combinations of Participants, That Formed the ACO:
- ACO professionals in a group practice arrangement
- Networks of individual practices of ACO professionals
- Partnerships or joint venture arrangements between hospitals and ACO professionals
Shared Savings and Losses
Amount of Shared Savings/Losses:
- Second Agreement Period
- Performance Year 2026, N/A
- Performance Year 2025, N/A
- Performance Year 2024, $2,522,761.82
- Performance Year 2023, $1,779,476,85
- Performance Year 2022, $0.00
- First Agreement Period
- Performance Year 2021, $5,051,089.53
- Performance Year 2020, $2,539,323.77
- Performance Year 2019, $2,029,734.03
- Performance Year 2018, $1,411,907.94
Shared Savings Distribution
- Second Agreement Period
- Performance Year 2026
- Proportion invested in infrastructure: N/A
- Proportion invested in redesigned care processes/resources: N/A
- Proportion of distribution to ACO participants: N/A
- Performance Year 2025
- Proportion invested in infrastructure: N/A
- Proportion invested in redesigned care processes/resources: N/A
- Proportion of distribution to ACO participants: N/A
- Performance Year 2024
- Proportion invested in infrastructure: 50%
- Proportion invested in redesigned care processes/resources: 0%
- Proportion of distribution to ACO participants: 50%
- Performance Year 2023
- Proportion invested in infrastructure: 50%
- Proportion invested in redesigned care processes/resources: 0%
- Proportion of distribution to ACO participants: 50%
- Performance Year 2022
- Proportion invested in infrastructure: N/A
- Proportion invested in redesigned care processes/resources: N/A
- Proportion of distribution to ACO participants: N/A
- Performance Year 2026
- First Agreement Period
- Performance Year 2021
- Proportion invested in infrastructure: 50%
- Proportion invested in redesigned care processes/resources: 0%
- Proportion of distribution to ACO participants: 50%
- Performance Year 2020
- Proportion invested in infrastructure: 50%
- Proportion invested in redesigned care processes/resources: 0%
- Proportion of distribution to ACO participants: 50%
- Performance Year 2019
- Proportion invested in infrastructure: 50%
- Proportion invested in redesigned care processes/resources: 0%
- Proportion of distribution to ACO participants: 50%
- Performance Year 2018
- Proportion invested in infrastructure: 50%
- Proportion invested in redesigned care processes/resources: 0%
- Proportion of distribution to ACO participants: 50%
- Performance Year 2021
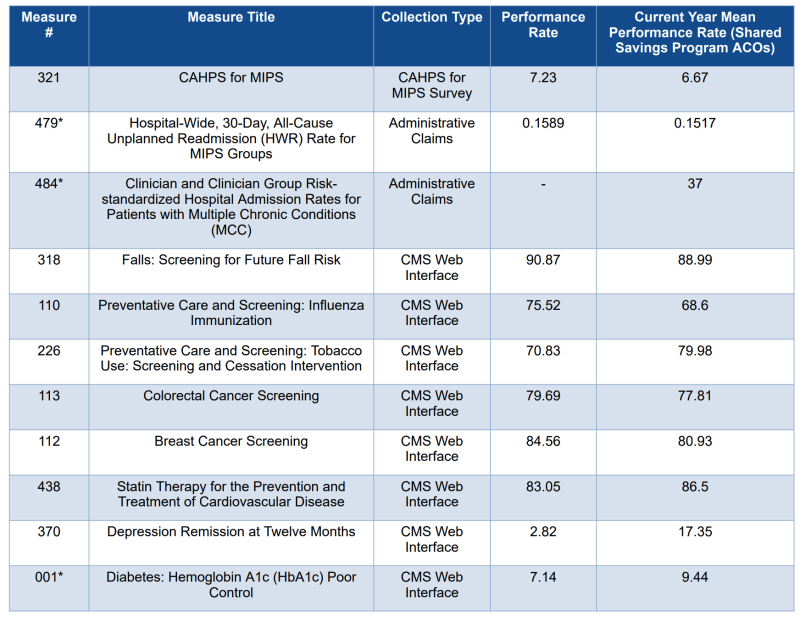
*For Diabetes: Hemoglobin A1c (HbA1c) Poor Control (>9%) [Quality ID #001], Hospital-Wide, 30-Day, All-Cause Unplanned Readmission (HWR) Rate for MIPS Eligible Clinician Groups [Measure #479], and Clinician and Clinician Group Risk-standardized Hospital Admission Rates for Patients with Multiple Chronic Conditions (MCC) [Measure #484], a lower performance rate indicates better measure performance.
*For Clinician and Clinician Group Risk-standardized Hospital Admission Rates for Patients with Multiple Chronic Conditions (MCC) [Measure #484], patients are excluded if they were attributed to Qualifying Alternative Payment Model (APM) Participants (QPs). Most providers participating in Track E and ENHANCED track ACOs are QPs, and so performance rates for Track E and ENHANCED track ACOs may not be representative of the care provided by these ACOs' providers overall. Additionally, many of these ACOs do not have a performance rate calcuated due to not meeting the minimum of 18 beneficiaries attributed to non-QP providers.